I had an exceeding late night last night… In the past I’ve been trying to offer substantive thoughts and comments on the growth of the Episcopal Calendar. I’ve even got a post in the pipeline on the 1988 revision of LFF. However, this morning there will be no substantive thoughts. Just pictures. I’ll let them do the talking…
Growth of Black Letter/Optional Observance Calendar Entries from 1957-2013
 Percentage by Gender from 1957-2013 by Revisions

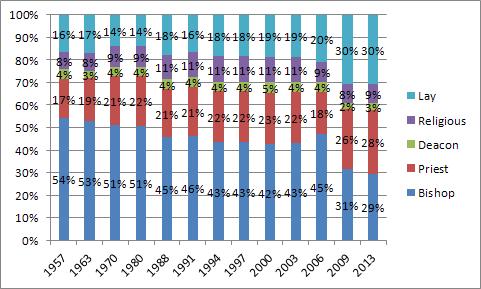
Percentage by Ordination Status from 1957 to 2013
 Percentage by Category from 1957 to 2013 [Click to Enlarge]
 Entries and Named Individuals by Century as of 1957
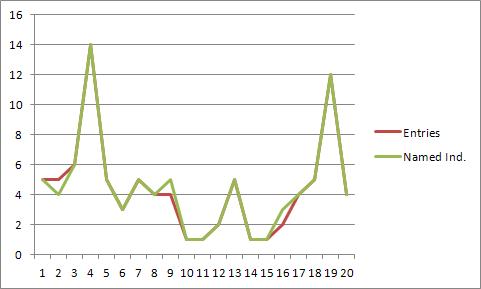
Entries and Named Individuals by Century as of 2013

Thoughts? Comments? Observations?
[Updated: This graph fills in some gaps between the last two. Here I have plotted together the sum of named individuals by century according to major revisions of the Calendar. Thus, you can see—especially when viewed alongside the first graph—when people of a certain time were added over and against others…]
